Top 10 Digital Analytics Tools to Use in 2023
Digital analytics tools help to harness the power of data to improve marketing, and product development decision making. They use page tags and cookies to get data on page views, conversions, and clicks from web page visitors.
Let’s delve into the intricacy of the article:
▶ What are Digital Analytics Tools?
▶ How to Use Digital Analytics Tools
▶ Best Web Digital Analytics Tools
▶ Digital Analytic Software 1: ClickMeter
▶ Digital Analytic Software 2: PageSpeed Insights
▶ Digital Analytic Software 3: Amplitude
▶ Digital Analytic Software 4: Adobe Analytics
▶ Digital Analytics Software 5: Hotjar
▶ Digital Analytics Software 6: Clicky
▶ Digital Analytics Software 7: Matomo
▶ Digital Analytic Software 8: Kissmetrics
▶ Digital Analytic Software 9: Woopra
▶ Digital Analytic Software 10: Segment
▶ Wrapping Up
What are Digital Analytics Tools?
Digital analytics tools are sophisticated software applications that capture, measure, analyze, and interpret big data from digital sites and apps. They provide businesses with valuable insights into user behavior, marketing performance, and online presence.
The core functionality of digital analytics tools is to help collect data from varying sources through cookies and page tags. They get information on clicks, conversions, and page views from sites users interact with.
Summarily, digital analytics tools and techniques help to bring disparate data into a cohesive framework.
How to Use Digital Analytics Tools
Digital Analytics tools are only effective when you use them the right way. They require in-depth knowledge of the technology, the ability to identify outcast data, and the wit to see through the weaknesses in software.
Below is information on steps to accurately use digital analytics tools:
Step 1: Set clear objectives
Clearly define your objectives and goals before you dive into data analysis. Determine the specific insights you aim to gain from the tool.
Do you want to better understand user behavior? Do you want to optimize marketing campaigns? Do you want to improve your website’s user experience?
Step 2: Choose the right tool
Opt for a digital analytics tool that aligns with your business objectives and requirements. Consider factors like reporting features, ease of use, cost, and data collection capabilities when making a choice.
Step 3: Implement tracking codes
Install necessary tracking codes or tags offered by analytics tools on your site or app. These codes enable data collection by capturing user interaction and sending them to your database for analysis.
Correctly implement these codes on necessary pages to capture the right datasets.
Step 4: Define key metrics
Note the key performance indicators that align with your corporate objectives. These may entail web traffic, conversion rates, revenue, average session duration, and bounce rate. Customize the reporting features of your analytics tools to track and display relevant metrics.
Step 5: Explore data visualization
Opt for a data analytics tool that can transform raw data into aesthetically appealing and digestible reports via the visualization capabilities of your chosen tool.
Ensure your chosen tool has charts, dashboards, and graphs to help you spot anomalies, and communicate insights in a clear manner. Use customizable templates where necessary, or adopt visualizations per company need.
Step 6: Analyze user behavior
View the user behavior data your analytics tool captured. Track how users navigate through your platform, the pages they interact with, and where they drop off in the conversion process.
Step 7: Optimize marketing campaigns
Leverage analytical tools to access the performance of your marketing campaigns. Metrics to analyze entail cost per acquisition, conversion rates, and click-through rates.
Step 8: Implement data-driven improvements
Make data-driven improvements using insights from analytics tools. For example, if you notice that users exit your page after a certain step, optimize the page’s user experience to improve your conversion rate.
Also, monitor the impact of these changes and iterate accordingly.
Step 9: Set up alerts and goals
Use alerting and goal-setting features in analytics tools to get notified when certain metrics are exceeded. Create goals to track your progress towards your targets and get automated reports.
Step 10: Constantly analyze and refine
Digital analytics is a never-ending phase, as such, regularly analyze and refine your strategies per insights from the software tool. Track trends, compare periodical performance, and watch out for patterns. Regularly iterate and optimize for the most desirable result.
Best Web Digital Analytics Tools
60% of companies around the world use data and analytics software. They use a host of tools to attain desired analytics results based on preference. As such, the best digital marketing analytics tools for your business is determined by the intricacy and goal of organizations.
Here are some of the best analytics tools for digital marketing to consider:
Digital Analytic Software 1: ClickMeter
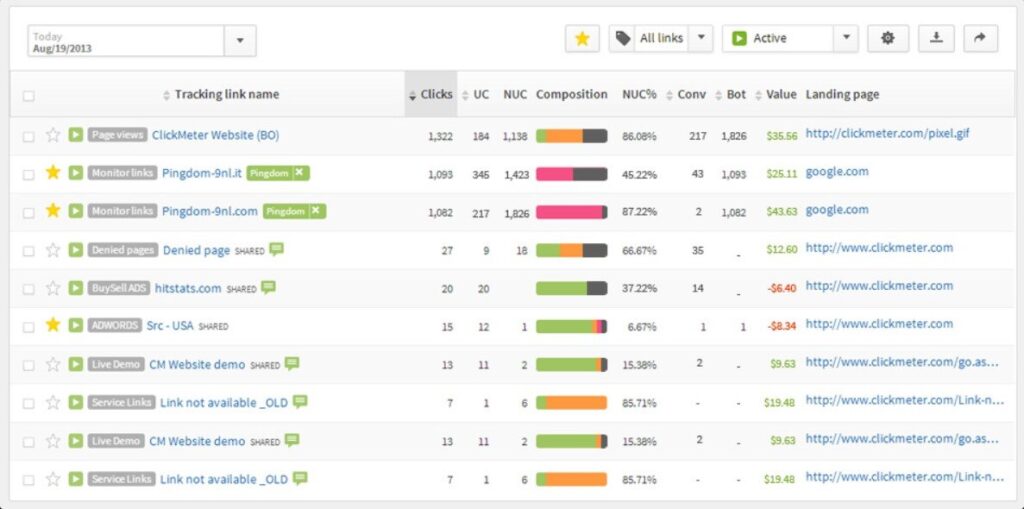
ClickMeter provides insights into the Return on Investment from different marketing channels. It offers users the ability to create custom URLs, track, and analyze them via over 100 parameters.
ClickMeter integrates with Google Analytics for more precise insights on website traffic. It also provides businesses with an analysis of the true effect of their marketing efforts to eliminate sources with no or low conversion rates.
Key Features and Use Cases
ClickMeter has a range of noteworthy features that appeals to its consumer base and delivers impressive results.
| Key Features | Use Cases |
| IP geo-targeting | This is an advertising feature that entails leveraging a user’s location data for personalized and location-specific content. |
| Conversion tracking | Conversion tracking is an essential feature as it helps know the success of campaigns. ClickMeter’s conversion tracking helps to see conversion location, follow up on rates. It also allows users to see the specific ads, keywords and campaigns bringing in the most desirable result. It provides insights on ROI to know what ads to keep, delete, or modify. |
| Link cloaking | Most times, URLs are long words with little unnecessary information. How would it make sense to an ordinary person if it has no meaning to a tech specialist? As such, reducing link length with this feature may improve your user experience, and click rate. Cloaked links are clean, and easy to share. |
| Tracking pixel | A tracking pixel, also called marketing pixel, is a pixel graphic that tracks site conversions, user behavior, web traffic, etc, in a similar manner to a cookie. These tiny images are embedded in emails and banner ads. |
Pricing
Below is the cost of subscribing to the ClickMeter tool:
- $29/ month for the medium package
- $99 for the large package
- $349/month for the extra-large subscription.
All plans provide access to A/B testing tools, excel import, excel export, revenue tracking, remarketing, retargeting, and conversion tracking.
Digital Analytic Software 2: PageSpeed Insights
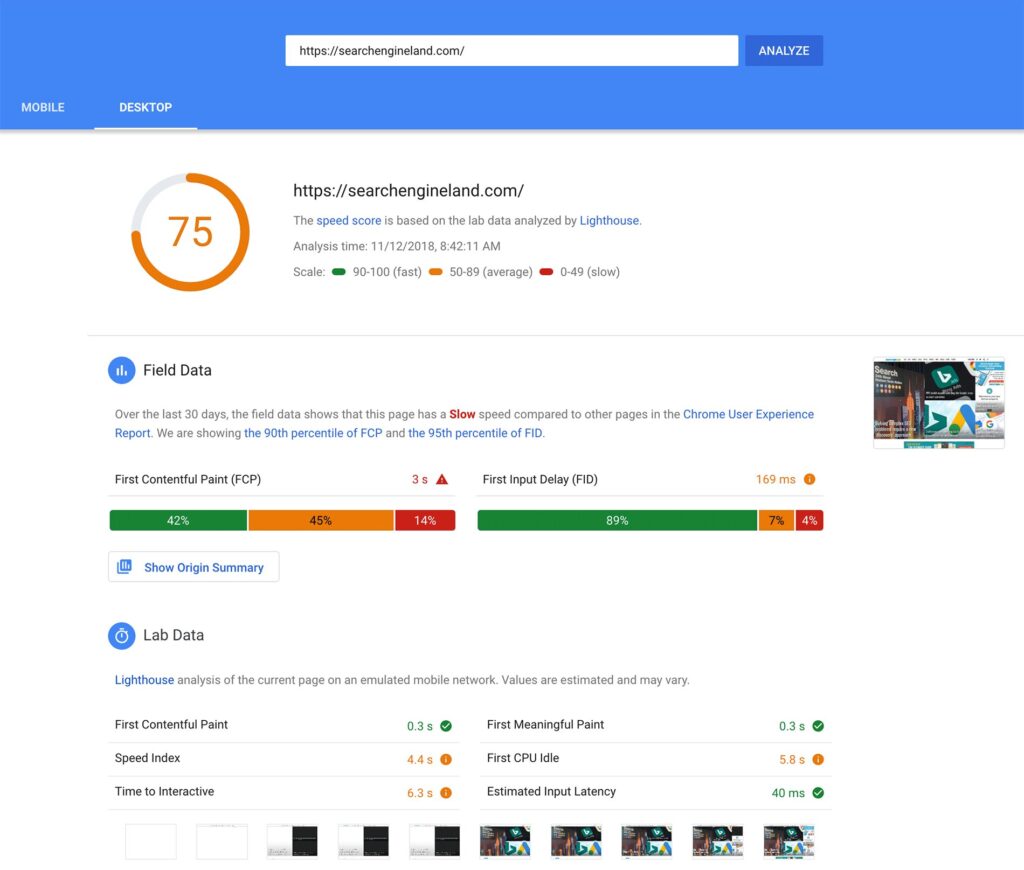
PageSpeed is a digital analytics software that’s designed to measure the speed and performance of a web page or site. It assists owners and digital analysts with identifying pain points in optimizing user experience.
Page speed software works by simulating website visits or page loads from different devices and locations. It collects data such as render time, server response time, and time to load different page elements (such as stylesheets, scripts, and images).
Key Features and Use Cases
The noteworthy features in PageSpeed Insights that makes it stand out are:
| Key Features | Use Cases |
| Mobile optimization analysis | With the increasing number of mobile users, page speed software often includes features specifically designed to analyze and optimize the performance of web pages on mobile devices. It provides insights into mobile-specific issues and offers tailored recommendations. |
| Recommendations and Optimizations | PageSpeed Insights offer users actionable recommendations for better performance. These include code optimization, caching strategies, file compression, and leveraging CDNs for optimized speed. |
| Webpage performance analysis | PageSpeed insights analyze data gathered to identify bottlenecks and potential improvement areas. It provides a better understanding of areas impacting the user experience and causing slowdowns. |
Pricing
PageSpeed Insights is free to use.
Digital Analytic Software 3: Amplitude
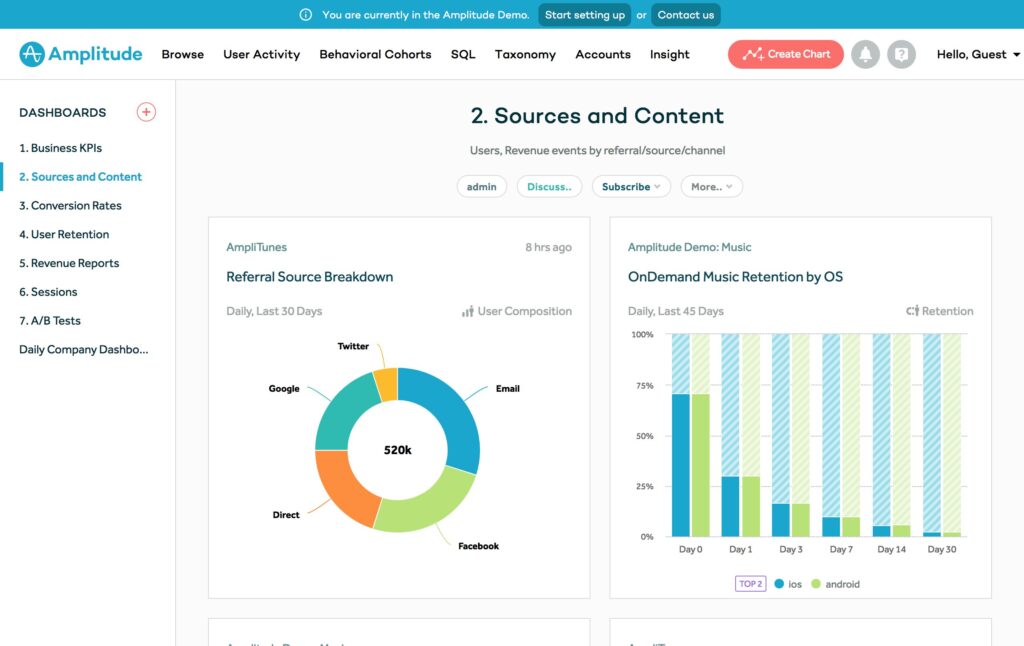
Amplitude is a digital analytics tool that helps to understand user activity. It provides information on how users navigate your platform, features they engage with, and suggests ways to improve your user retention.
Amplitude is designed to meet the intricate needs of growth teams by providing real-time analytics, customer support, enterprise-level security, cross-platform tracking, and powerful behavioral analytics. These solutions assist product owners to measure the impact of experiments and new releases. Lastly, the platform benchmarks new features against old ones.
Key Features and Use Cases
| Key Features | Use Cases |
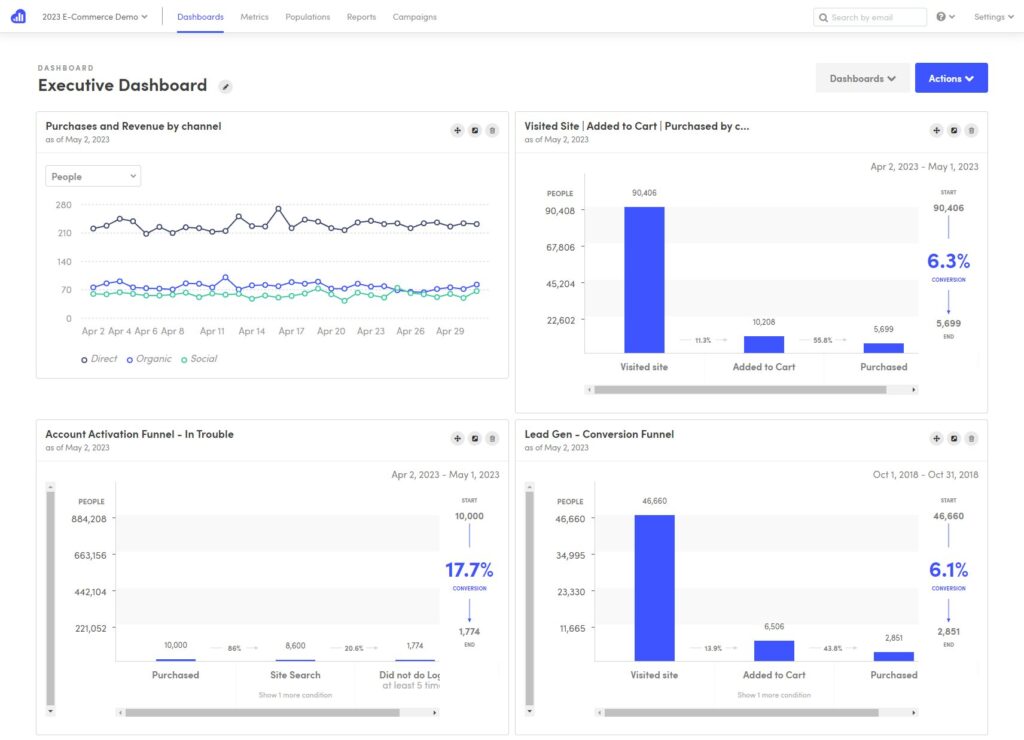
| Funnel Analysis | Its funnel analysis feature helps users to create and analyze conversion funnels to understand how users move through different stages of your product. This feature is used to identify bottlenecks and optimize the user journey till the platform’s goals are met. |
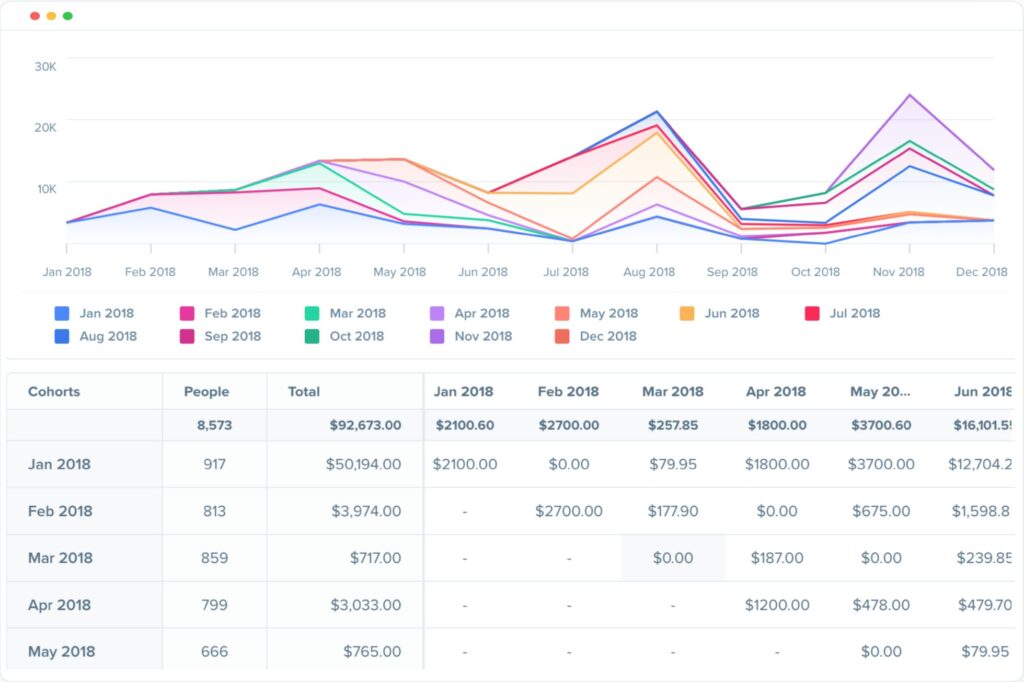
| Cohort Analysis | This feature allows analysts to group users based on specific characteristics or behavior. This feature helps users understand the effect of product changes on different user segments. |
| Data Visualization and Reporting | Amplitude provides customizable and intuitive data visualizations, including graphs, dashboards, and charts to help understand data effectively. This feature allows users to create and share reports with stakeholders, enabling data-driven decisions. |
| A/B Testing and Experimentation | Amplitude has tools for running A/B tests and experiments to assess the impact of product changes on business metrics and user behavior. This feature allows you to test variations of your product and tracks its effects on conversion rates and other KPIs. |
Pricing
Amplitude’s pricing structure is as follows:
- Starter – free plan
- Growth – Its growth plan costs about $995+ monthly. The exact amount depends on your company’s needs. You may request a demo to know how the tool works.
- Enterprise – Price for businesses starts out at $2000 per month.
Digital Analytic Software 4: Adobe Analytics
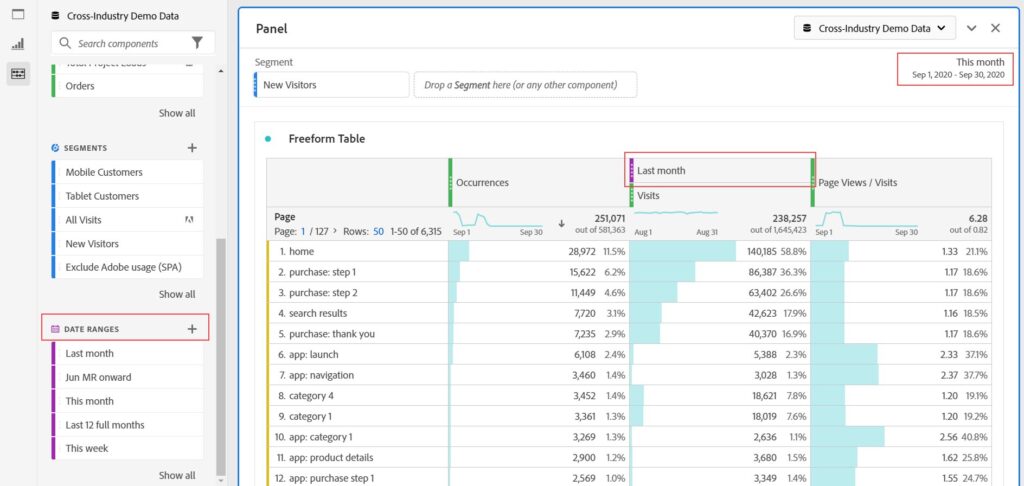
Adobe Analytics is a multichannel data gathering tool. At its core are Artificial Intelligence and Machine learning tools that identify and extract data such as page views, bounce rates and other important KPIs to improve your bottom line.
Also, Adobe Analytics compiles data for online channels like videos, social media, mobile app, and web applications to better understand your target audience, and for more targeted ads.
Its AI has a powerful prediction model, thus, helping to reduce common pain points in decision making.
Key Features and Uses
Adobe Analytics analyzes over 1 trillion visits to retail websites in the U.S. due to its performance that are mostly fueled by these features:
| Key Features | Use Cases |
| Advanced calculated metrics | Adobe’s advanced calculated metrics helps to combine multiple KPIs to create statistical and mathematical operations. |
| Data Integration and Cross Analysis | Adobe Analytics integrates with other Cloud solutions and third-party systems to consolidate information from multiple sources. Its 3rd party integration capabilities enable cross-channel analysis, providing businesses with a holistic view of customer preferences. |
| Attribution Modeling | Adobe Analytics include attribution modeling capabilities to understand the effect of different campaign strategies. You can then allocate funds and efforts to each campaign based on the contribution. |
| Predictive Analytics | This feature incorporates predictive modeling and machine learning to forecast user behavior, make data-driven predictions, and identify trends. This feature helps businesses anticipate user needs, optimize campaigns, and improve decisions. |
| Real-Time Analytics | This feature provides real-time data analysis, helping enterprises monitor user activity and performance metrics instantly. This feature is good for the timely tracking of changes in user behavior. |
Pricing
Adobe Analytics does not publicly make its price known as the tool is priced per user, based on the intricacy of the platform you’re analyzing.
Digital Analytics Software 5: Hotjar
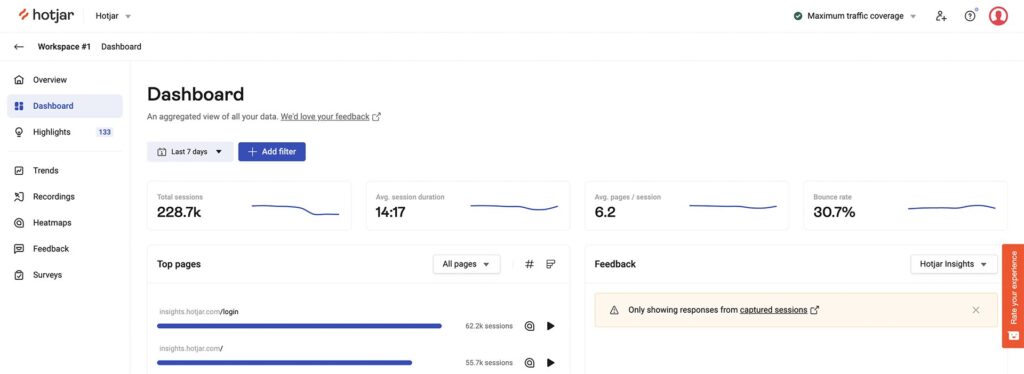
Hotjar is a web analytics and user feedback platform that provides insights into visitors’ interaction on your website. It offers a host of tools to help marketers and website owners optimize their sites, improve user experience, and understand your target audience’s behavior.
Over 402 million have interacted directly or indirectly with the platform. As such, it can be considered a popular digital analytics platform.
Hotjar has a range of key features that entails, session recordings, surveys, user feedback tools, actionable insights, and heatmaps. Let’s breakdown the features and their use cases:
Key Features and Use Cases
At the crux of hotjars popularity are its features. Lets discuss the features and their intricacies:
| Key Features | Use Cases |
| Heatmaps | Hotjar creates visual heatmaps of user activity on your websites. It highlights hotspots, to know areas of preference and poor user experience. This feature shows where users click, where users move their mouse, and how far they scroll the page. |
| Session Recordings | This feature records user sessions, letting you replay how users interact on your website. It’s effective in identifying navigation problems, usability issues, and other UX challenges. |
| Surveys and Feedback | Hotjar has tools that can help you create customizable survey and feedback forms. You can customize this survey and forms to be triggered based on users behavior. |
| Conversion Funnels | Hotjar allows you to set up and track marketing campaigns to track conversion rate. It notifies you of areas where web visitors exit your platform. |
| Form Analytics | This feature provides you with information on how visitors interact with forms on your platform. The information it tracks entails errors, submission rates, and field behavior. |
Pricing
Hotjar has four pricing plans, these are:
- Basic – $0
- Plus – $32/month
- Business – $80/month
- Scale – $171/month
Digital Analytics Software 6: Clicky
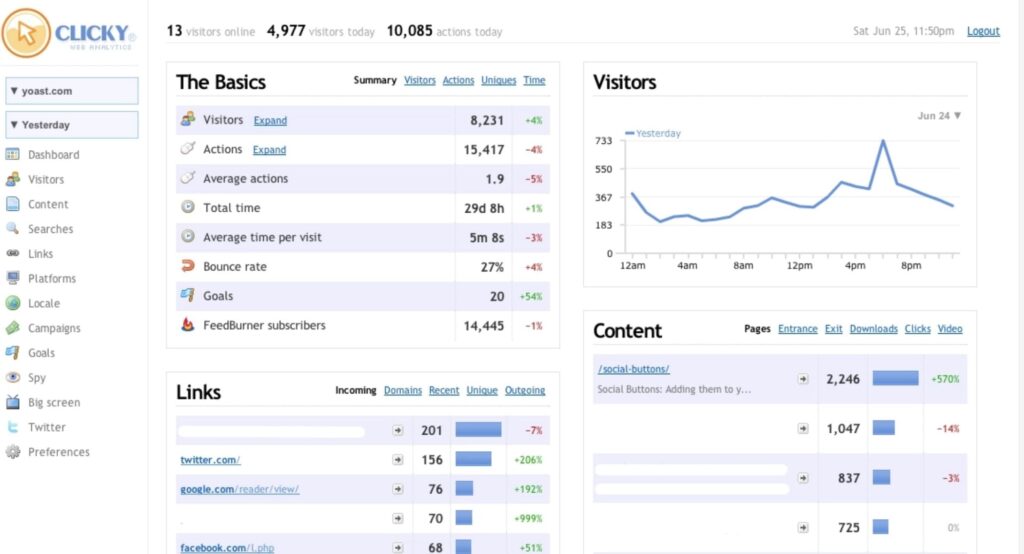
Clicky is a cloud-based web analytics product that’s designed to assist businesses track, evaluate website visitors. The web application permits administrators to observe your site’s uptime in different locations, and get notified when they’re offline.
It allows marketing teams to set up and track goals for their pages. They can also track outbound links, downloads, conversion rates etc. Clicky allows team members to get notified on Twitter mentions in real time, and auto-prepares activity reports for hashtags, sentiments, links, and users.
This software allows users to integrate with third-party tools like Joomla, Shopify etc.
Its features include heatmaps, path analysis, data export, split testing etc.
Key Features and Use Cases
Clicky’s primary features are:
| Key Features | Use Cases |
| Split testing | This feature provides an avenue to test different web pages and compare user interactions on them. |
| Data export | Data from this tool can be exported via different formats to multiple third-party integrable tools. |
| Path analysis | This feature analysis user journey on your platform before achieving your desired goal. |
| Heatmaps | Heatmaps provide information on the extent users interact with different pages on your website. |
Pricing
Pricing differs based on the needs of your organization.
- Free – $0
- Pro – $9.99/ month
- Pro plus – $14.99/ month
- Pro platinum – $19.99/ month
- Custom – Varies
Digital Analytics Software 7: Matomo
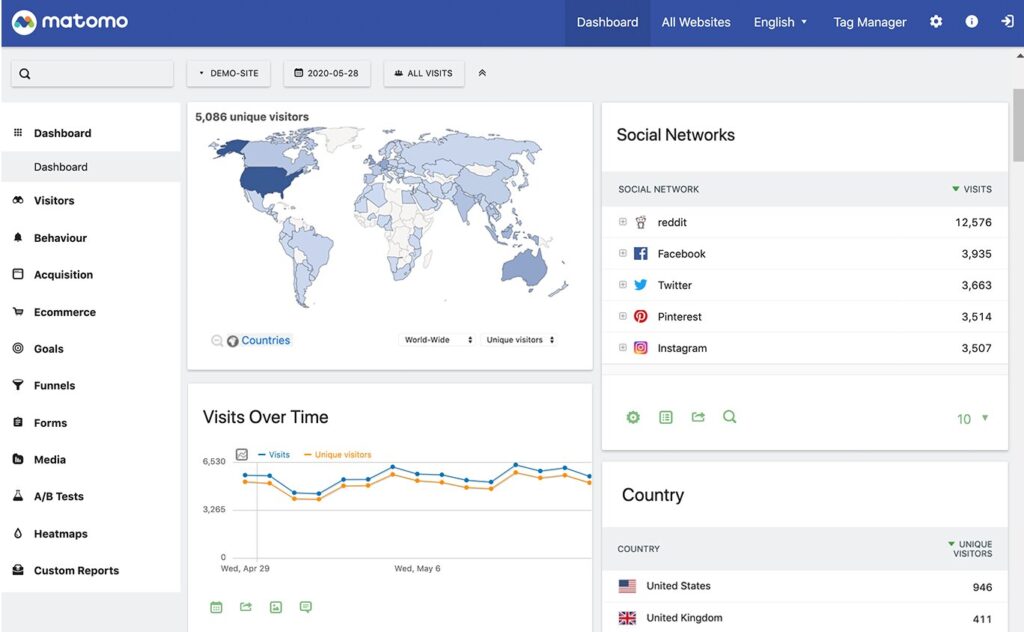
Matomo is an open-source web analytics tool for powering over 1 million sites in more than 190 countries. With Matomo, users can track web visitors’ journeys and analyze their experience on your platform.
It has visitor profiles to help understand prospects, and multiple comparison features to help you understand your business growth. Its visitor profile includes the actions of every individual on a personal level. This way, you can reveal the experience and preferences of each visitor, and can use that for target ads.
Matomo is intergrable with platforms like forums, eCommerce stores, and Content Management Systems.
Key Features and Use Cases
| Key Features | Use Cases |
| Funnels feature | Funnels let you map all on-site touchpoints for all kinds of customers. They’ll examine the results you’re getting as prospects leave your website. |
| A/B Testing | It helps you statistically verify the best of two ideas. This feature allows you to speed test: Call-to-action and page slogans, Pricing information, Seasonal promo offers and banners, Submission form placements. |
| Matomo Tag Manager | Unlike new scripting that adds weight to the software and makes it slower, Matomo tag manager easily generates tags for: Newsletter signups, Form submission tracking, Exit popups and surveys, Affiliates, Etc. |
| Custom Alerts | Custom alerts let you set up emails and text-based alerts about preferred web metrics in just a few clicks. Matomo will send you an alert once you attain that metric.You can also set multiple custom alerts on your account. For example, you may create a web admin to alert for technical performance issues like a sudden traffic spike, DDoS attack, etc. |
| Roll-Up Report | Roll-up reporting provides you with a 360-degree view of important KPIs such as conversion rates, global revenue, and form performance on numerous sites.It saves hours on manually exporting and cross-mapping data from different analytics tools. |
Pricing
Matomo Analytics has 9 pricing editions that range from $0 to $2,090.
The platform offers a free trial per business request. Check out the pricing editions below:
- Basic plan – $0
- Essential – $9,
- Business – $29,
- Enterprise – $199,
- Content Optimization Bundle – $579,
- Growth Bundle – $1,149,
- Premium Bundle – $1,499,
- Email Support Subscription – $2,090.
Digital Analytic Software 8: Kissmetrics
Kissmetrics is a web analytics and customer engagement platform that provides insights into user behavior and helps businesses optimize their marketing and conversion strategies.
It focuses on tracking and analyzing customer interactions and activities throughout the customer journey.
Key Features and Use Cases
| Key Features | Use Cases |
| Customer tracking | Kissmetrics allows businesses to track users based on their behavior and actions. |
| Event Tracking | Kissmetrics can track specific events. It’s an excellent feature for tracking user onboarding processes, marketing campaigns, and customer retention strategies. |
| Behavioral Email Automation | It provides email automation features that allow businesses to send targeted emails to users based on specific behaviors. For example, you can send an email to users that abandoned their cart. |
| Data Visualization and Reporting | It has an intuitive dashboard to visualize and analyze data. |
Pricing
Kissmetrics has varying pricing editions that are ideal for different business types. You can also access a free trial for the software.
Take a look at its 3 pricing edition:
- Silver – $299/ month.
- Gold – $499/ month
- Platinum – custom price that’s based on user demand, and the intricacy of your platform.
Digital Analytic Software 9: Woopra
Woopra is an end-to-end user journey analytics software that helps to track everything users do. It helps to acquire and retain more customers with its advanced analytics feature.
Woopra currently enjoys patronage from industry giants like Amazon, redhat, Informatica, SRAM, and YAMAHA.
Key Features and Use Cases
The key features in Woopra are:
| Key Features | Use Cases |
| Time on Site Tracking | This metric helps to calculate the extent of time users spend on a website. It provides insight to better understanding your users and business applications. |
| User Interaction Tracking | It tracks how they interact with your platform, and sales team. |
| Campaign Management | This feature helps you identify the strategies you’ll need to support your business goals. It also assists with designing, planning, testing, and monitoring your ads. |
| Report Generation | Report generation generates the data you need, and displays it in an easily readable format. |
Pricing
Woopra offer 3 pricing plans:
- Core: $0
- Pro: $999 / month
- Enterprise: Custom
Digital Analytic Software 10: Segment
Segment is a customer data analytic platform that helps businesses collect, unify, and manage customer information from numerous sources.
Segment provides a centralized platform to gather and analyze information, and businesses can take data-driven actions.
Key Features and Use Cases
| Key Features | Use Cases |
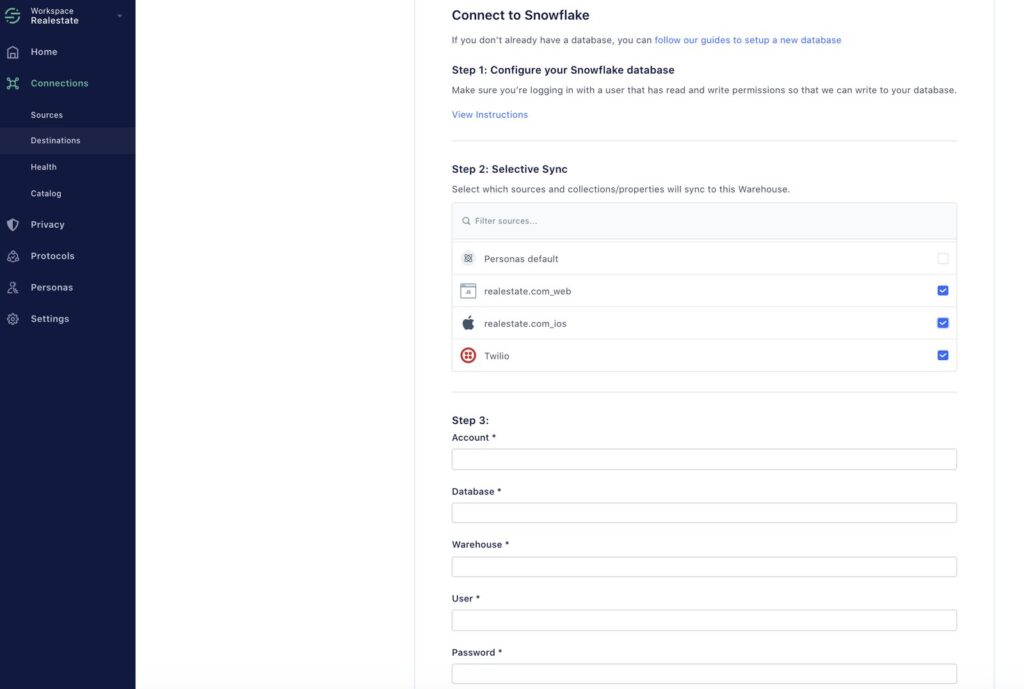
| Data Activation | Segment allows businesses to activate customer data by sending it to other systems or platforms for execution. This can include triggering marketing automation, personalizing website experiences, or sending data to analytics tools for further analysis. |
| Audience Segmentation | Segment enables businesses to segment their customer base based on specific criteria and attributes. This segmentation helps personalize messaging, target specific customer segments, and deliver more relevant and targeted marketing campaigns. |
| Customer Profile Management | Segment allows businesses to create and manage comprehensive customer profiles. These profiles include attributes and data points collected from different sources, providing a centralized view of each customer’s characteristics and activities. |
Pricing
The cost ranges from $0 to over $2000 per month depending on the complexity of your business. Let’s delve into the intricacy:
- Free : $0
- Basic : $120 / month
- Businesses : Custom
Wrapping Up
Digital Analytics tools are software that captures and analyzes data from a range of digital platforms. They provide insights into actions of users for better understanding of their preferences.
In this article are information on steps to use data analytics tools, and a summary top analytical tools in digital marketing to use.
Digital analytics tools help to harness the power of data to improve marketing, and product development decision making. They use page tags and cookies to get data on page views, conversions, and clicks from web page visitors. Let’s delve into the intricacy of the article: ▶ What are Digital Analytics Tools?▶ How to Use Digital Analytics Tools ▶ Best Web…